Theme guide
Play
Images are examples only. Download the app to study the full theme with English as your guide.
Theme video
数据比较 video
Watch this theme card with English guidance and Simplified Chinese vocabulary.Vocabulary list
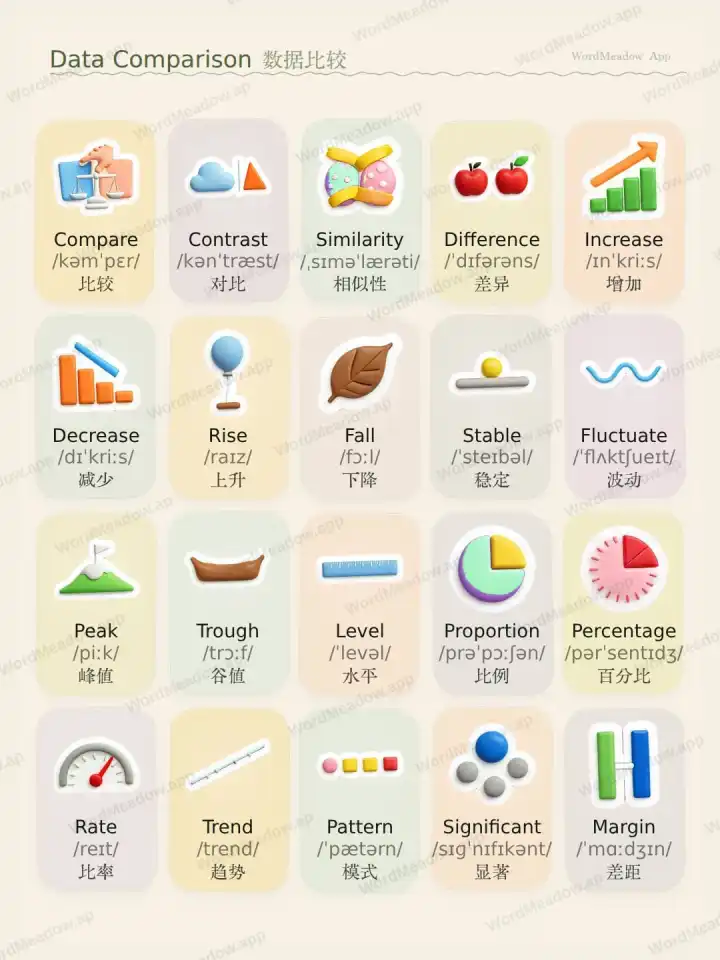
Browse words, pronunciation, translations, and example sentences.比较
Compare
我们在做决定前先比较这两张图表。We compare the two charts before making a decision.
对比
Contrast
这份报告对比了城市增长和乡村衰退。The report contrasts urban growth with rural decline.
相似性
Similarity
这两个方案之间有明显相似性。There is a clear similarity between the two plans.
差异
Difference
主要差异在于完成任务所需的时间。The main difference is the time required to finish the task.
增加
Increase
公司预计下个季度销售额会增加。The company expects sales to increase next quarter.
减少
Decrease
我们需要在不降低质量的前提下降低成本。We need to decrease costs without lowering quality.
上升
Rise
气温在下午上升得很快。Temperatures rise quickly in the afternoon.
下降
Fall
当需求减弱时,利润就会下降。Profits fall when demand weakens.
稳定
Stable
汇率已经稳定了好几个星期。The exchange rate has remained stable for weeks.
波动
Fluctuate
乘客数量会随季节波动。Passenger numbers fluctuate depending on the season.
峰值
Peak
假期高峰期间交通会达到峰值。Traffic reaches its peak during the holiday rush.
谷值
Trough
图表显示冬季销售出现谷值。The graph shows a trough in winter sales.
水平
Level
暴风雨过后,水位上升了。The water level rose after the storm.
比例
Proportion
更多比例的学生选择了线上课程。A larger proportion of students chose online classes.
百分比
Percentage
预算中只有很小一部分花在了营销上。Only a small percentage of the budget was spent on marketing.
比率
Rate
本月失业率略有下降。The unemployment rate fell slightly this month.
趋势
Trend
消费者行为中正在出现一种新趋势。A new trend is emerging in consumer behavior.
模式
Pattern
这个模式每三个月重复一次。The pattern repeats every three months.
显著
Significant
这个变化大到足以影响最终结果。The change was significant enough to affect the final result.
差距
Margin
这家公司以微弱差距获胜。The company won by a narrow margin.
Get the WordMeadow app for the full study flow
More themes, tap-to-listen practice, saved words, short readings, and spelling exercises come together in the app.
More themesListen and repeatSaved reviewSpelling practice
 Open on the App Store
Android is coming
Use the iOS version for now. The Android download entry will appear here when it is ready.